# The Crowded Room problem: Constraints on correlations <span class="badge badge-draft2">✎ Rough draft</span>
Not all combinations of correlations are possible in a correlation matrix. This is sometimes described as the 'crowded room' problem. By analogy, the more people are packed into a room, the closer they have to stand to one another, and there is less and less freedom for how each individual occupies the space. Similarly, the more correlations are in a matrix, the less freedom they, with each value required to be within narrower and narrower bounds.
Take a simple example:
- X is highly correlated with Y (e.g., r = .9)
- X is also highly correlated with Z (e.g., r = .9)
- Intuitively, Y and Z cannot be highly negatively correlated (e.g., r = -.9)
Formally, the constraints on a correlation triangle are defined by the fact that correlation coefficients are the cosines of the angles between vectors in a high-dimensional space, meaning the third correlation is bounded by the cosine of the sum and the cosine of the difference of the other two angular distances.
This is easier to demonstrate an example than to grasp the math:
```{r}
library(dplyr)

# define function
correlation_consistency <- function(rXY, rXZ, rYZ = NA, digits = 2){


  # Calculate bounds
  lower_bound <- cos(acos(rXY) + acos(rXZ))
  upper_bound <- cos(abs(acos(rXY) - acos(rXZ)))

  # Clamp bounds to [-1, 1]
  lower_bound <- pmax(-1, pmin(1, lower_bound))
  upper_bound <- pmax(-1, pmin(1, upper_bound))

  res <- data.frame(
    rXY = rXY,
    rXZ = rXZ,
    rYZ = rYZ,
    rYZ_lower = round(lower_bound, digits = digits),
    rYZ_upper = round(upper_bound, digits = digits)
  ) |>
    mutate(consistent = ifelse(!is.na(rYZ), rYZ > rYZ_lower & rYZ < rYZ_upper, NA))

  return(res)
}

# usage
correlation_consistency(rXY = .90, rXZ = .90) %>%
  select(rYZ_lower, rYZ_upper)
```
Given the high correlations between X-Y and X-Z, the correlation between Y-Z must be within the bounds [.62, 1.00].
This also applies to larger correlation matrices, where all correlations place constraints on all others. Valid correlation matrices where these interlocking constraints are met are said to be 'positive definite', in the sense that all eigenvalues are greater than zero. This likely requires further reading to appreciate.
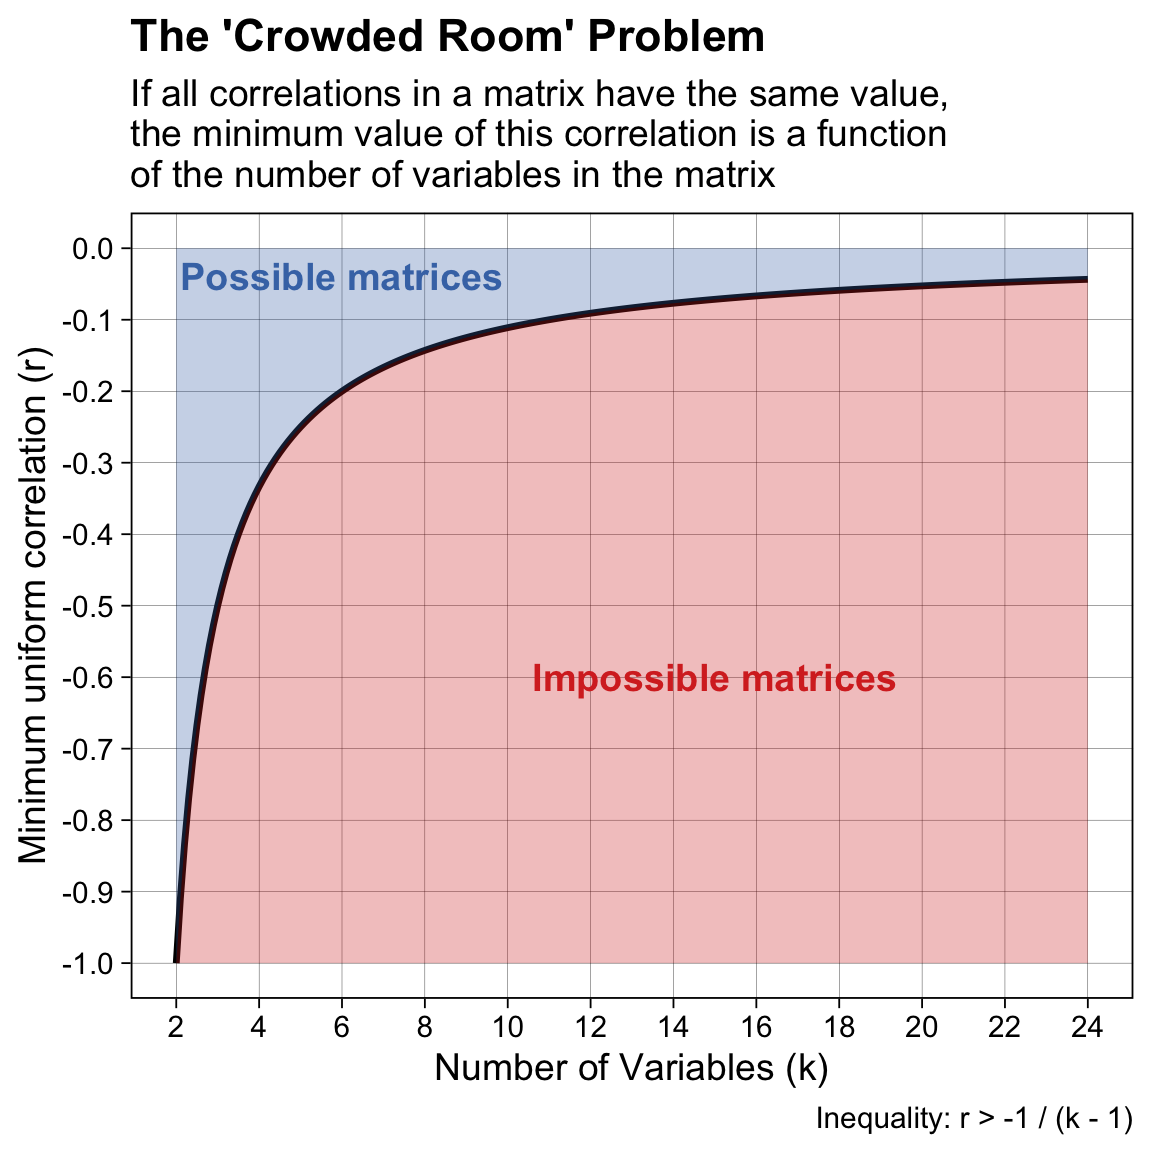
One extension of the above: if all correlations in a matrix are the same value (e.g., all correlations in the matrix are .3), there is a very predictable relationship between the number of variables in the matrix and the minimum possible value that the correlations can take. Note that this only holds for when all correlations in the matrix are identical, not for other distributions of correlations in a matrix.
```{r fig.height=6, fig.width=6}
library(ggplot2)
library(dplyr)

# 1. Generate Data for the theoretical limit
# Range of dimensions k from 2 to 25
plot_data <- data.frame(k = seq(2, 24, by = 0.1)) |>
  mutate(min_r = -1 / (k - 1))

# 2. Create the Plot
ggplot(plot_data, aes(x = k, y = min_r)) +
  # Add the geometric limit line
  geom_line(size = 1.2, color = "black") +

  # Shade the "Impossible" region (Below the line)
  geom_ribbon(aes(ymin = -1, ymax = min_r), fill = "#d73027", alpha = 0.3) +

  # Shade the "Possible" region (Above the line, up to 0 for this view)
  geom_ribbon(aes(ymin = min_r, ymax = 0), fill = "#4575b4", alpha = 0.3) +

  # Add Labels to the regions
  annotate("text", x = 15, y = -0.6, label = "Impossible matrices",
           color = "#d73027", fontface = "bold", size = 5) +
  annotate("text", x = 6, y = -0.02, label = "Possible matrices",
           color = "#4575b4", fontface = "bold", size = 5, vjust = 1) +

  # # Add specific points for context (The "Crowded Room" examples)
  # geom_point(data = data.frame(k = c(2, 3, 5, 11), y = c(-1, -0.5, -0.25, -0.1)),
  #            aes(x = k, y = y), size = 3) +
  # geom_text(data = data.frame(k = c(2, 3, 5, 11), y = c(-1, -0.5, -0.25, -0.1)),
  #           aes(x = k, y = y, label = paste0("k=", k, "\nmin r=", y)),
  #           nudge_y = 0.08, nudge_x = 0.5, size = 3.5, lineheight = 0.9) +

  # Formatting
  scale_y_continuous(limits = c(-1, 0), breaks = seq(-1, 0, 0.1), name = "Minimum uniform correlation (r)") +
  scale_x_continuous(breaks = seq(2, 24, 2), name = "Number of Variables (k)") +
  theme_linedraw(base_size = 14) +
  labs(
    title = "The 'Crowded Room' Problem",
    subtitle = "If all correlations in a matrix have the same value,\nthe minimum value of this correlation is a function\nof the number of variables in the matrix",
    caption = "Inequality: r > -1 / (k - 1)"
  ) +
  theme(
    panel.grid.minor = element_blank(),
    plot.title = element_text(face = "bold")
  )
```